Finding out the impossible: A UX Research case study
How to find the ratio of advertised properties to total inventory of real estate consultants?
Knowing the answer to this question provides insights into the extent of available properties that are not currently advertised. By understanding the percentage of unadvertised properties, the online marketplace can strategize ways to encourage consultants to showcase more listings, enhancing the platform's overall property inventory and attractiveness to potential buyers or tenants.

Tehran, Iran
2012
Classified Ads. Marketplace
$4 million (2023)
1,000+
About Divar
Divar is a leading online classifieds platform in Iran, with +35 million active users. Our platform allows users to buy and sell a wide range of products and services, including real estate, cars, electronics, and household items.
About the Challenge
Finding the answer to “How many ads each agent has posted” is one of the easiest tasks, We can simply run a query finding the count of ads posted by the agent in the specified time.
The real challenge is finding “How many properties each agent has available and currently working on.” There are several reasons:
Recall
They can't recall the exact number.
Privacy
They don't want to share how many properties they are working on.
Category
They may give us the number of a specific category for example number of houses or apartments.

Product Goals
At Divar, our aim is to become the number one online marketplace for both real estate agencies and individual users looking to buy or sell properties in Iran. Our product goals include:
Providing a comprehensive archive and coverage of available properties.
Fulfilling our users' needs by offering a vast array of options that cater to their preferences.
Becoming the go-to platform for both real estate agencies.
Research Goals
To achieve our product goals, we are conducting research on the proportion of real estate agent listings on our platform. Specifically, we aim to answer this question:
🔎
What percentage of their available properties do real estate agents advertise on Divar?
Importance of Research

This research is crucial to improving the user experience on our platform by providing more relevant and accurate search results. By understanding the distribution of property listings on our platform, we can identify whether we need to:
Attract more individual sellers and reduce our dependence on real estate agents, or
Increase the number of ads posted by each real estate agent to achieve a more populated and diverse listing.
By addressing these issues, we can enhance the user experience on our platform and ultimately achieve our goal of becoming the leading online marketplace for buying and selling properties in Iran.
Research
To find the answer to our research question we need to find the values of these metrics per each real estate agent (At the time):
1. How many properties does each agent have available and currently work on?
2. How many ads each agent have posted?
After finding the answer to those metrics for each agent, We can calculate an average and calculate a result for each segment (More on segments later)
What is the challenge?
Finding the answer to “How many ads each agent has posted” is one of the easiest tasks, We can simply run a query finding the count of ads posted by the agent in the specified time.
The real challenge is finding “How many properties each agent has available and currently working on.” There are several reasons:
Real estate agents don't want to share How many properties they are working on,
They can't recall the exact amount,
They may give us the number of a specific category for example number of houses or apartments.
After finding the answer to those metrics for each agent, We can calculate an average and calculate a result for each segment (More on segments later)
⚠️
Answering this question with 100% certainty isn't possible unless We have direct access to their document system or their offline archive.
How to overcome

My approach to solving this issue was, Instead of asking the exact question: “How many of your properties have you available in your hands”, I tried dividing my question into 7 alternative questions:
Designed questions
1
Tell us about the files that you have spent more time on, received more visits, and were looking for a customer. Give us the average number of properties you work on each day.
Here I tried to reach the short-term memory, getting an average daily number of properties that agents work on (daily).
2
Out of the files you mentioned, how many of them did you advertise on Divar?
Here I tried to reach a control factor, I can compare this data to the actual usage of the agent and reach a success factor indicating whether or not I can relate to the answer of the agent
3
The number of ads you post on Divar depends on what items/options of properties.
4
Why didn't you post more of your properties?
5
What features should the properties you are working on have, to be advertised on Divar?
The last three questions were asked to generate a qualitative insight that helped us find out why agents don't post more properties on Divar and how to change our product in order to provide an opportunity to have those properties posted on Divar.
6
Out of every 10 files you receive, how many of them have these features?
7
What percentage of the files you actively work on and spend more time on are advertised on Divar?
By asking these 7 questions we have:
3 Different data points of “Available Properties that agents have in hand”
2 Different data-validation points that we can check the given answers against our data and reach a cleaner and closer to truth data.
Calculation

As explained in the previous section, due to the specificity of the research question and the unreliability of relying on the respondents' answers, an effort was made to collect all data from several different questions. Sufficient data points were obtained to eliminate bias and minimize errors in recalling information.
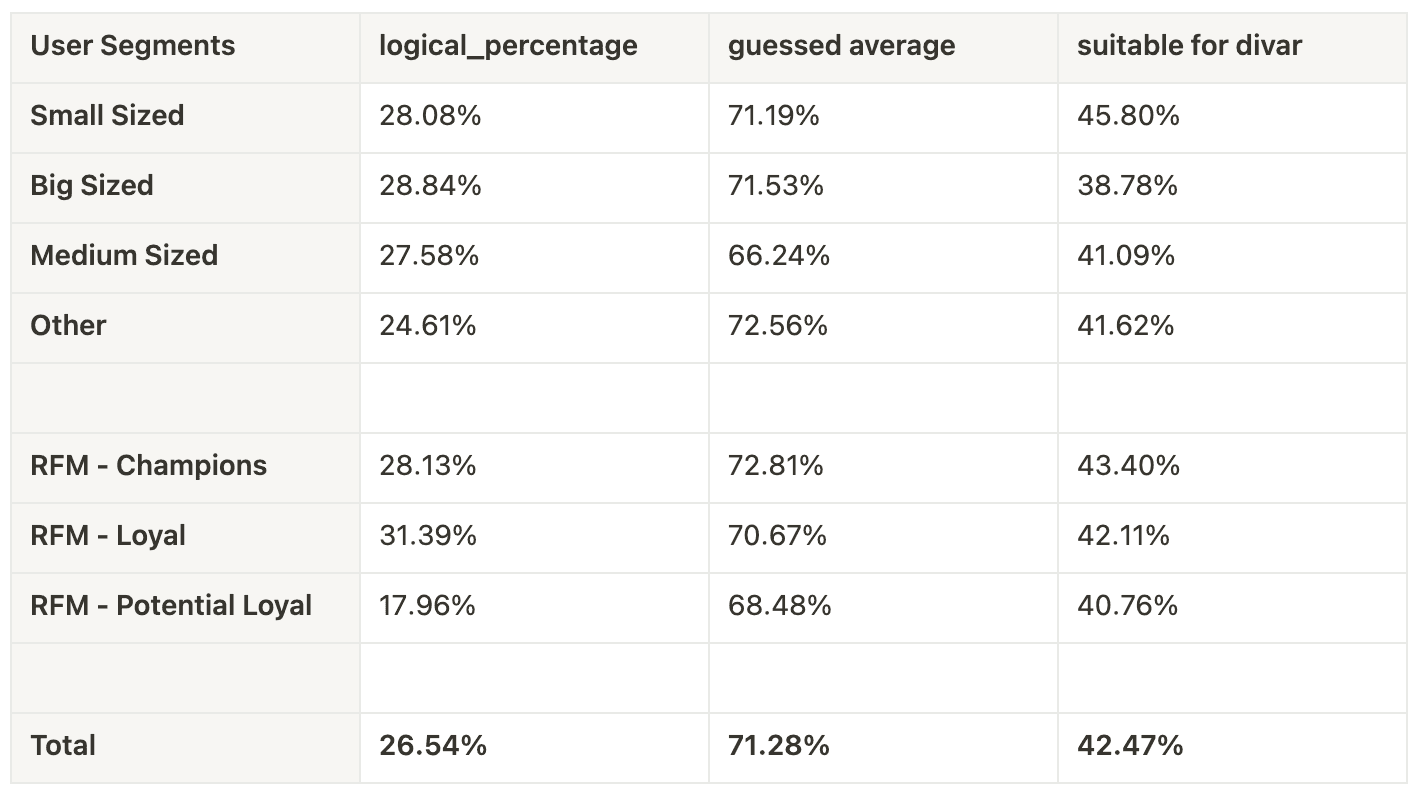
The "percentage of Divar ad posts from each agent files" factor was obtained through three methods. These three factors were calculated in columns D, E, and F. These two factors are the result of comparing the research subject's responses to two questions, which are located in columns 1-data-point and 2-data-point. In column G, using logic examining the information and verifying it with Divar data, one of these two factors was selected.
Finally, by comparing all the individual statements and identifying the final value, that value was used as the logical percentage in other analyses. In the tables below, you can see the comparison of the final result with two factors, guessed average and suitable for Divar.
The data recorded in the suitable for Divar column are the results of responses to the question, "What percentage of the files you receive is suitable for posting on Divar?" The data recorded in the guessed average column are the results of the response to the question, "What percentage of your files do you post on Divar?"
All three factors can be considered as answers to the research question, and by comparing these three factors, it can be understood that consultants indicate at least twice the actual ratio of files they post on Divar, and by using the calculation method mentioned above, we were able to accurately determine this ratio.
Results
💡
Agents post an average of 26.54% of the available properties on Divar.
🔥
Before diving into data analysis, I want to mention an interesting observation. As you can see in the above table, Users guessed as much as twice of the real amount. We should Never rely on the user sayings, We should gather proximity metrics and try to match and validate correct results.
Analysis
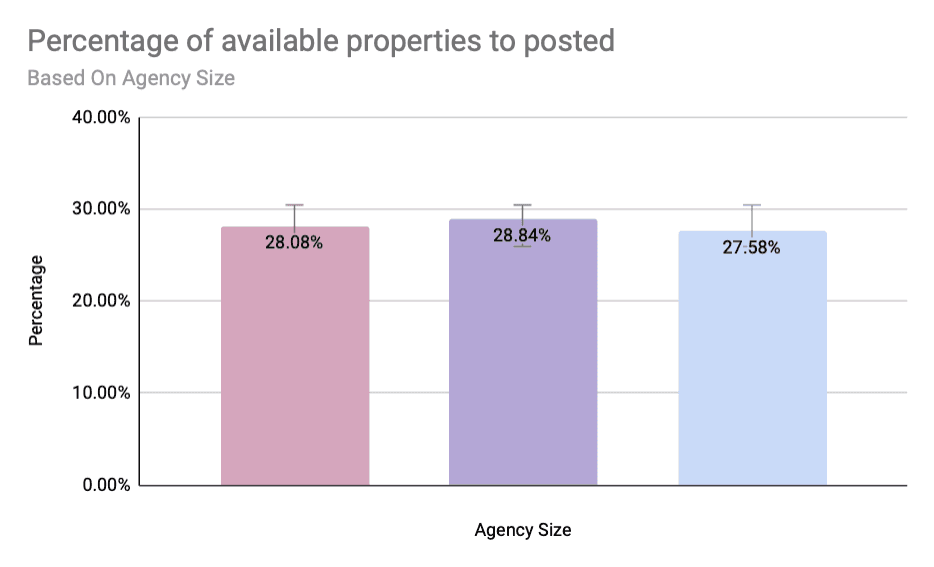
The difference between these three segments is very small and not significant. We can claim that the behaviour of advertising files has no relation to the type (Size) of the real estate agency.
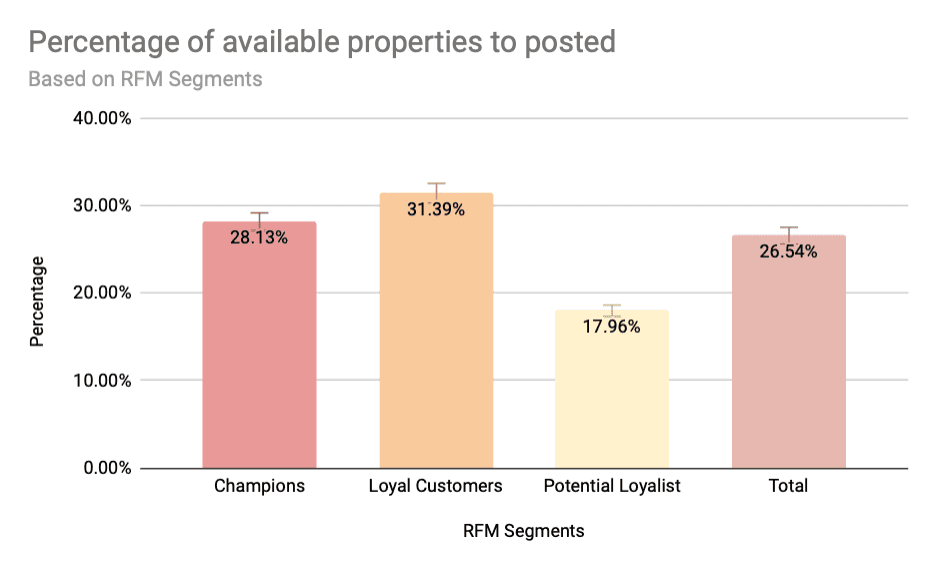
The difference between the Loyal segment and the Champion segment is within the range of statistical error and cannot be trusted, and a significant difference is found between these two segments and the Potential Loyalist segments.
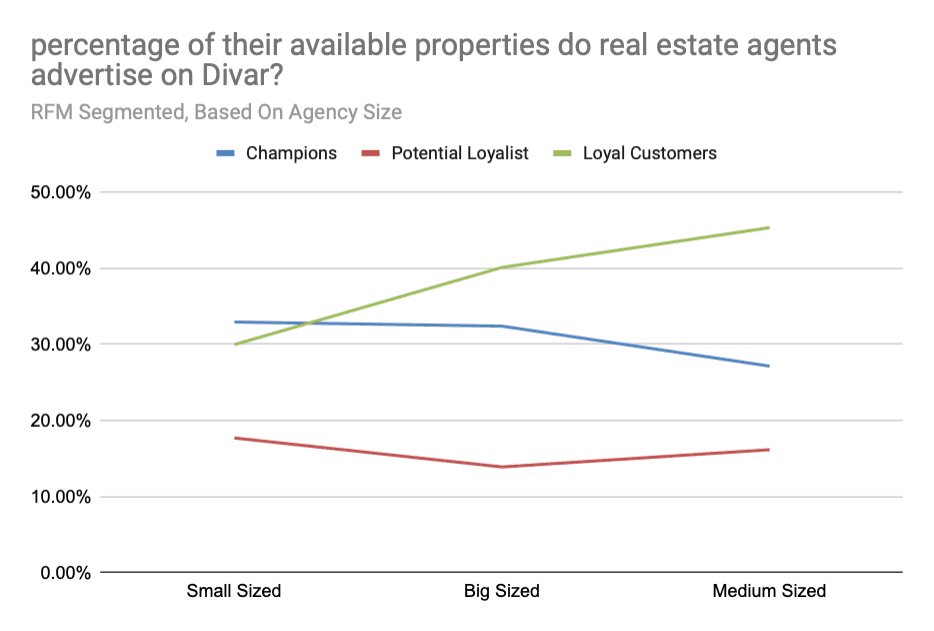
The difference in results between the real estate types in the Champions and Loyal segments is small and it can be claimed that these two segments have similar behaviour in different types (the number of advertising files on Divar).
As can be seen in the above graph, both the Loyal and Champion segments are above average, and the Loyal segment with a larger difference is below average.
The difference in results between the real estate types in the Champions and Loyal segments is small and it can be claimed that these two segments have similar behaviour in different types (the number of advertising files on Divar).
More about this research
Method
Quantitative - User interviews with more than 2000 Real Estate Agents
The UX method of quantitative research involves collecting and analyzing numerical data to gain insights into user behaviour, needs, and preferences. In the case of the call centre phone interview with real estate agents of the mentioned agencies, this method can provide valuable information about their experience and satisfaction with the call centre services.
To conduct quantitative research, the call centre can use various tools such as online surveys, phone interviews, or questionnaires. In this case, the call centre opted for phone interviews to gather data from real estate agents. The interviews were structured to ensure consistency and accuracy in the responses received.
The call centre can use statistical analysis techniques to analyze the data collected from the interviews. This will enable them to identify trends, patterns, and correlations in the responses. By using this information, the call centre can gain insights into the agents' behaviour, needs, and preferences. The insights can be used to improve the call centre services, address any issues or concerns raised, and enhance the overall user experience.
In conclusion, the UX method of quantitative research is an effective way for the call centre to gather and analyze data from real estate agents of the mentioned agencies.
Target group
Real estate agents of the care segment of RFM segmentation include champions, loyal customers, and potential loyalists, We chose these types of users because they are the most important persona in the Real Estate vertical of Divar.
These real estate agencies were divided into three categories based on the number and type of panel member agents: Small, Medium, and Big Sized Agencies.
This filter was used to identify and compare the relationship between real estate types and the advertising habits of consultants.
The advertising statistics of each agent include the number of advertisements registered since the beginning of June along with the daily average number of advertisements registered by all agents to receive and verify the number of registered advertisements of each agent.
It is assumed that the amount, number, and method of registering advertisements by consultants are different based on the conditions mentioned above.
Our goal in comparing consultants based on the mentioned types was to cover and classify similar consultants together so that we could reach more accurate and precise results by asking questions related to the types of individuals.